
Local elections: How did the parties do compared with previous years?
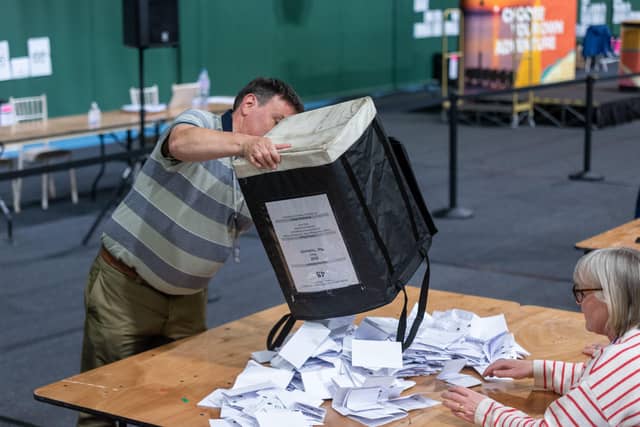

The final results from the local elections in England have been announced, after Birmingham City Council finished counting its votes on Monday evening.
Here the Press Association looks at what the full set of results show in terms of how each party fared, and how the figures compare with results from previous elections.
– Seats won and lost
No two sets of local elections are alike – each year a different number of council seats are up for grabs across a mixture of local authorities in different areas of the country.
As such, comparing the number of seats won and lost from year to year can be misleading; a party may have gained or lost more seats than before, simply because more seats were in play.
This year, Labour suffered a net loss of 1,229 of the seats it held just before the elections took place.
This is far greater than the party’s net loss of 198 seats last year.
The Tories made a net loss of 433 seats this year, fewer than the 635 it lost last year, while Reform made a net gain of 1,372 seats, far higher than the 648 it recorded last year.
But how much of this was due to more seats being up for grabs this year than in 2025?
– Seats successfully defended
One way to take this into account is to look not at numbers, but at percentages.
For example, what proportion of seats defended by Labour and the Conservatives at this election did each of the parties lose, compared with last year?
Labour defended 2,297 seats going into this set of local elections and made a net loss of 54% of them, while the Tories defended 1,234 and lost 35%, according to Press Association results data.
These percentages are lower than at the 2025 local elections, when both parties suffered a net loss of 67% of seats they were defending – so this year, Labour and Tories actually did better at hanging on to seats.
But Labour still lost more than half of its seats for the second year in a row, something that never happened when the party was previously in government during 1997-2010.
The Conservatives’ worst performance in local elections while in government from 2010-2024 was in 2024, when it lost 44% of seats it was defending.
– Candidates’ success
While Labour and the Tories both saw a net loss in seats at this year’s local elections, the Liberal Democrats, Reform and Greens all made a net gain.
A way of comparing their success is to look at how well those parties did in winning the seats in which they stood candidates.
Reform fielded 4,789 candidates this year, 30% of whom (1,454) won their seat.
This is a lower success rate than last year, when 42% of Reform candidates were victorious.
By contrast, the Greens saw 13% of their candidates win a seat this year (587 out of 4,478), almost double the rate in 2025, when they won 7%.
The Liberal Democrats contested 3,942 seats, winning 21% (844) – down from 27% last year.
– Regional variation
Another way of measuring the parties’ performance this year is to contrast how well or how badly they did in separate areas of England.
There is a stark difference between how parties fared in London and how they did outside the capital.
Labour lost 33% of the council seats in London it held just before the elections took place.
This compares with a loss rate of 70% for seats the party was defending outside London.
The Lib Dems, Reform and Greens all increased their number of councillors, both in the capital and across the rest of England, but with varying levels of success.
Reform won just 5% of the seats in London in which it fielded candidates, compared with 43% of the seats it contested elsewhere in England.
The Greens won 19% of seats in London in which it stood candidates, higher than the 10% it managed outside the capital, while the Lib Dems won 16% in London compared with 25% elsewhere.
Labour and the Conservatives together won 61% of seats up for grabs in London this year: the lowest combined percentage for the two parties in the modern history of local government in the capital, dating back to when the current system of councils was established in 1964.
Their combined winning share of seats up for grabs across the rest of England was even lower, at just 24%.